Models verified for OCC-furnish containerboard and TMP-based publication papers. Prediction and control of BCTMP properties has been implemented; kraft pulp models are coming.
By Mark Williamson, Journalist Engineer
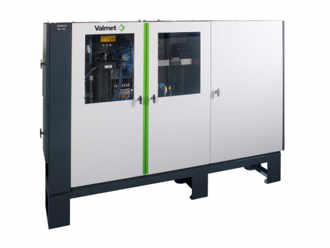
Online measurements by Valmet’s Pulp Analyzer (Valmet MAP) are the foundation for paper strength prediction
 Valmet’s announcement that it had developed the capability to predict end-use paper strength properties signaled a major change in how paper quality can be controlled effectively and conclusively from an upstream location. For the first time, operators can see online how fibers are developed in the refiners and the impact of refining changes on paper sheet qualities, rather than waiting for top-of-reel physical tests. This paradigm shift is made possible by a new high definition image analysis of fiber properties added to the Valmet MAP. With this high resolution, the fine detail of fiber fibrillation created by the refiners can be seen, in addition to fiber length fractions, shives, fines, other fiber morphology measurements and freeness measurement from several sampling locations. Seeing is believing. These measurements and papermachine operating conditions are now used in a multi-variable soft sensor model which predicts final sheet properties. These predictions correlate to traditional lab tests.
Of course, the same measurements can be made with offline lab instruments, and that is valuable for grade development, recipe management and incoming fiber property checking. However, for real-time process control, the immediacy of measurements from the online analyzer confirms the control moves are correct and tests are not being sacrificed.
Models confirmed
Now, the results are coming to light as customers are learning more about stock prep processes. One of the first was at a newsprint and publication paper mill using TMP as the furnish. Product Manager Ismo Joensuu reports; “The tensile strength model based on the analyzer data in their TMP has been stable and accurate over the years. Actually, we have not made any updates to the model since installation.” This is a positive confirmation that the model is repeatable and robust, which is essential for any online measurement. After using the measurement for operator adjustments, the customer plans to implement refining controls in the autumn of 2016, according to Joensuu.
More recently, the analyzer has been used to measure OCC furnish fiber properties and freeness before a containerboard machine. Papermakers have to carefully manage the refining operation since they have to deal with a fiber source which is less desirable and less predictable than virgin kraft fibers. Figure 1 shows the correlation of the soft sensor prediction of STFI compression to laboratory tests over an eight-day period. Similar predictive models have been developed for Mullen and Concora tests.
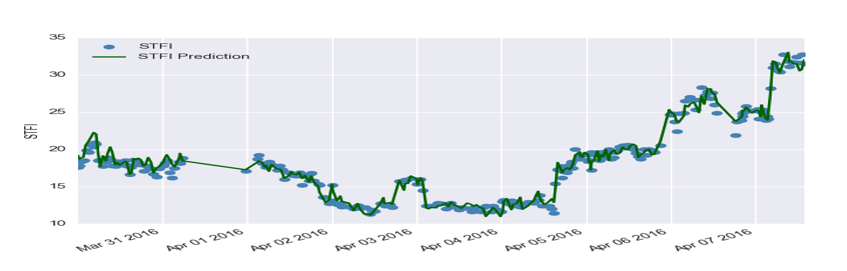
Figure 1: Correlation of soft sensor prediction of STFI compression to laboratory results over an eight-day period. Similar predictive models have been developed for Mullen and Concora tests.
The models are based on multiple fiber measurements, freeness and board machine operating conditions. The top ranked measurements include longer fiber fractions and conditioned weight. This is not surprising since long fibers make stronger board and higher conditioned weight adds strength - at a cost of course. Other important factors include fibrillation and papermachine operating conditions, like headbox temperature, rush/drag ratio, forming table vacuums and couch vacuum. The eventual objective is to manage refining so the fibers themselves contribute the most to strength. Then, conditioned weight can be lowered - or not run too high - while still meeting the tests. Startups, grade changes and break recovery periods can be shorter with less waste.
A new window
The installation of the OCC analyzer has opened up a new window that wasn’t there before. The fiber and freeness measurements have confirmed in real-time what papermakers have always known about refining, but there have been a few surprises. For instance, the degree of fiber cutting, fiber development and fines development in top and bottom ply refiners is now well defined but sometimes different than expected. In one case, a conventional operator control action was contradicted by the predictive measurements. After analyzing the data, the predictive action was proven true. “The fiber images don’t lie,” says Kevin VanPembrook, Product Manager. “Freeness still plays a significant role but fiber analysis and freeness together tell a more complete story,” he adds.
Fiber analysis can also be used to predict refiner plate life. As VanPembrook explains, there is a tendency to over-refine to achieve freeness targets as the plates wear, and that can result in fiber cutting and loss of strength.
Pulp mill modeling
The pulp analyzer and soft-sensor modeling is also implemented in pulp mills where important fiber properties are being predicted. In a BCTMP mill bulk and tensile strength are being predicted by soft sensor models which use freeness (CSF), shives and fines measurements from the pulp analyzer plus bleach plant pH, which an advanced process control (APC) regulates to keep bulk and tensile within range. Bulk measurements from the lab and tensile tests from Valmet’s Pulp Expert automated testing lab are used to fine tune the predictive model. The APC manipulates peroxide and caustic dosage to control medium consistency brightness, high consistency brightness, residual peroxide, pH , and final pulp bulk and tensile strength.
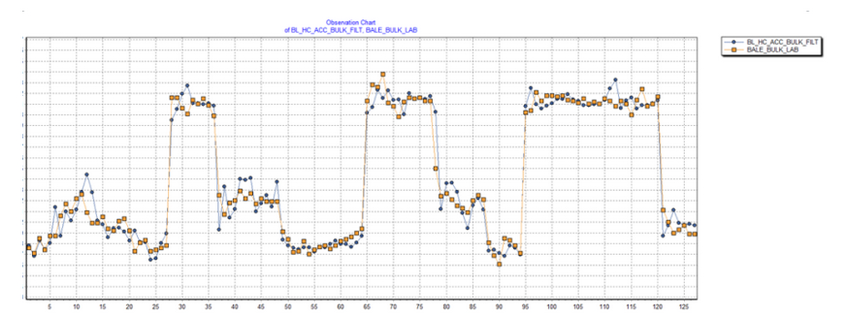
Figure 2: Predicted bulk of different BCTMP grades (blue) compared to lab tests (brown).
Furthermore, a bleached kraft pulp mill is currently commissioning an analyzer to measure fiber properties in the machine chest of a pulp dryer. Data are being collected now to construct models of pulp strength and bulk which could be related to upstream pulping and bleaching conditions. This is something to look out for in the future, as many commodity pulp mills want to fine tune quality to customer specs.
Linking pulp to paper quality
Successful model-based controls which optimize final paper quality by managing stock prep systems are based on earlier versions of the pulp analyzer, not including the most recent high definition image analysis. These so-called pulp to paper optimization controls use inputs of automated testing labs as well as manual tests to update the models. Figure 3 shows how refining and stock blending control work with multiple inputs from the pulp analyzer. Further reports on the implementation of controls will be interesting to follow.
Note: A more thorough explanation of Valmet’s approach to strength prediction and control was presented at the Japan Tappi conference in October, 2016.
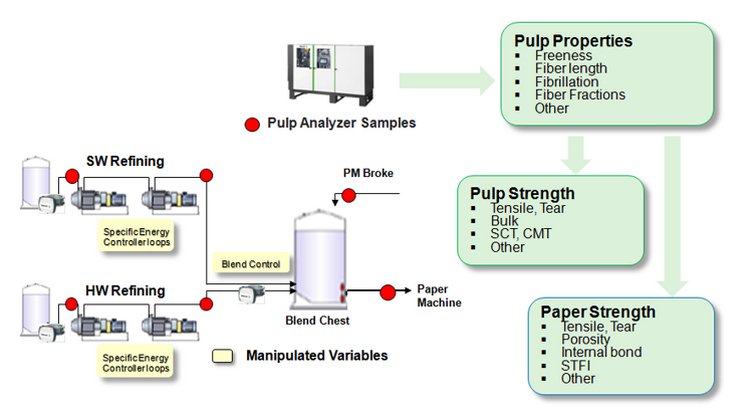
Figure 3: Model predictive control of refining and stock blending with multiple inputs from an online pulp analyzer.