Verso's net sales for the third quarter of 2012 decreased $83.8 million, or 18.4%, compared to the third quarter of 2011, reflecting a 14.9% decline in total sales volume, which was driven by the closure of three paper machines late last year and the closure of the Sartell mill in the third quarter of this year, as well as a 4.0% decrease in the average sales price per ton for all of our products. Verso's gross margin was 19.1% for the third quarter of 2012 compared to 17.8% for the third quarter of 2011.
Verso reported a net loss of $104.7 million in the third quarter of 2012, or $1.98 per diluted share, which included $92.7 million of net charges from special items, or $1.75 per diluted share, primarily due to restructuring charges related to the closure of the Sartell mill in the third quarter of this year. Verso had a net loss of $0.3 million, or $0.01 per diluted share, in the third quarter of 2011, which included $1.1 million of charges from special items, or $0.02 per diluted share.
"We experienced our typical seasonal pick-up in demand during the third quarter in both coated freesheet and coated groundwood shipments. Industry operating rates were strong even though we continue to see a year over year drop-off in advertising spending which is impacted by the sluggish GDP growth. As we anticipated, coated groundwood pricing moved higher during the quarter and coated freesheet pricing was stable. Adjusted EBITDA of $50.2 million was about double what we recorded in the second quarter of this year driven by the stronger volumes, higher prices and improvements in our manufacturing costs resulting from our cost improvement programs and having the second quarter scheduled maintenance outages behind us," said David Paterson, President and Chief Executive Officer of Verso.
"During the quarter, we made the difficult decision not to restart the Sartell Mill and are well into evaluating the options relative to the decommissioning of the site and marketing the properties and assets for eventual sale.
"Looking ahead, we anticipate that coated groundwood prices will continue to move up during the fourth quarter and coated freesheet pricing to remain relatively stable. Coated volumes will move slightly lower than the seasonally stronger third quarter, but we do not anticipate a significant drop-off. We'll finish the year at very good inventory levels with coated groundwood inventory fairly tight. Operating costs and input prices should remain flat to down slightly, although we do have a scheduled maintenance outage at our Quinnesec Mill during the quarter. Finally, we are excited about the start-up of ourBucksport Renewable Energy Project during the quarter which will complete the last of the initiatives included in the first phase of our energy strategy that you've heard us talk a lot about."
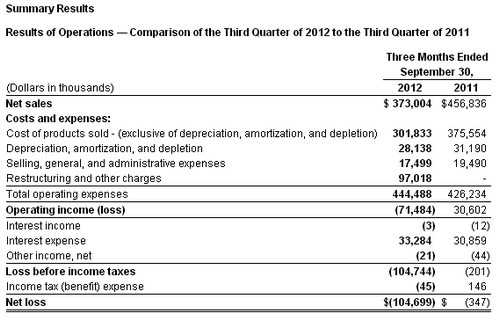
Net Sales. Net sales for the third quarter of 2012 decreased 18.4%, to $373.0 million from $456.8 million in the third quarter of 2011, led by a quarter-over-quarter decline in the price of pulp. Additionally, total sales volume was down 14.9% compared to the third quarter of 2011, which was driven by the shutdown of three paper machines late last year and the closure of the Sartell mill in the third quarter of this year, as well as a 4.0% decrease in the average sales price per ton for all of our products.
Net sales for our coated papers segment decreased 19.7% in the third quarter of 2012 to $300.9 million from $374.5 million for the same period in 2011, due to a 17.4% decrease in paper sales volume, which was driven by the shutdown of three paper machines late last year and the closure of the Sartell mill in the third quarter of this year. The average sales price per ton of coated paper decreased 2.8% compared to the same period last year.
Net sales for our market pulp segment decreased 13.1% in the third quarter of 2012 to $35.1 million from $40.4 million for the same period in 2011. The average sales price per ton decreased 11.0% while sales volume decreased 2.3% compared to the third quarter of 2011.
Net sales for our other segment decreased 11.7% to $37.0 million in the third quarter of 2012 from $41.9 million in the third quarter of 2011. This decrease was due to an 11.5% decrease in sales volume, while the sales price per ton remained flat.
Cost of sales. Cost of sales, including depreciation, amortization, and depletion, was $329.9 million in the third quarter of 2012 compared to $406.7 million in 2011, reflecting realized cost reduction from the shutdown of three paper machines late last year and the closure of the Sartell mill in the third quarter of this year. Our gross margin, excluding depreciation, amortization, and depletion, was 19.1% for the third quarter of 2012 compared to 17.8% for the third quarter of 2011. Depreciation, amortization, and depletion expenses were $28.1 million for the third quarter of 2012 compared to $31.2 million for the third quarter of 2011.
Selling, general, and administrative. Selling, general, and administrative expenses were $17.6 million in the third quarter of 2012 compared to $19.5 million for the same period in 2011, primarily driven by a decrease in personnel costs.
Restructuring and other charges. Restructuring and other charges for the third quarter of 2012 was $97.0 million, and consisted primarily of fixed asset and other impairment charges of $75.8 million and severance and benefit costs of $16.3 million related to the closure of the Sartell mill.
Interest expense. Interest expense for the third quarter of 2012 was $33.2 million compared to $30.8 million for the same period in 2011.
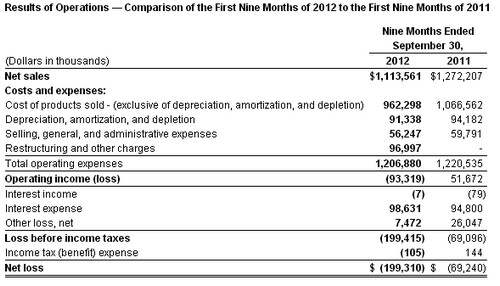
Net Sales. Net sales for the nine months ended September 30, 2012, decreased 12.5% to $1,113.6 million from $1,272.2 million for the nine months ended September 30, 2011, reflecting an 8.9% decrease in total sales volume, which was driven by the shutdown of three paper machines late last year and the closure of the Sartell mill in the third quarter of this year. Additionally, the average sales price for all of our products decreased 3.8%, led by a decline in the price of pulp.
Net sales for our coated papers segment decreased 15.1% to $889.1 million for the nine months ended September 30, 2012, from $1,046.9 million for the nine months ended September 30, 2011. This change reflects a 13.2% decrease in paper sales volume, which was driven by the shutdown of three paper machines late last year and the closure of the Sartell mill in the third quarter of this year. The average sales price per ton of coated paper decreased 2.1% compared to the same period last year.
Net sales for our market pulp segment decreased 7.2% to $104.2 million for the nine months ended September 30, 2012, from $112.3 million for the same period in 2011. This decrease was due to a 12.5% decline in the average sales price per ton while sales volume increased 6.0% compared to the nine months ended September 30, 2011.
Net sales for our other segment increased 6.4% to $120.3 million for the nine months ended September 30, 2012, from $113.0 million for the nine months ended September 30, 2011. The improvement in 2012 is due to a 9.2% increase in sales volume, reflecting the continued development of new paper product offerings for our customers. The average sales price per ton decreased 2.5% compared to the nine months ended September 30, 2011.
Cost of sales. Cost of sales, including depreciation, amortization, and depletion, were $1,053.6 million for the nine months ended September 30, 2012, compared to $1,160.7 million for the same period last year, reflecting realized cost reduction from the shutdown of three paper machines late last year and the closure of the Sartell mill in the third quarter of this year. Our gross margin, excluding depreciation, amortization, and depletion, was 13.6% for the nine months ended September 30, 2012, compared to 16.2% for the nine months ended September 30, 2011, reflecting higher average sales prices during 2011. Depreciation, amortization, and depletion expenses were $91.3 million for the nine months ended September 30, 2012, compared to $94.2 million for the nine months ended September 30, 2011.
Selling, general, and administrative. Selling, general, and administrative expenses were $56.3 million for the nine months ended September 30, 2012, compared to $59.8 million for the same period in 2011, primarily driven by a decrease in personnel costs and other fees.
Restructuring and other charges. Restructuring and other charges for the nine months ended September 30, 2012 was $97.0 million, and consisted primarily of fixed asset and other impairment charges of $75.8 million and severance and benefit costs of $16.3 million related to the closure of the Sartell mill.
Interest expense. Interest expense for the nine months ended September 30, 2012, was $98.6 million compared to $94.8 million for the same period in 2011.
Other loss, net. Other loss, net for the nine months ended September 30, 2012, was a net loss of $7.5 million compared to a net loss of $26.1 million for the nine months ended September 30, 2011. Included in the results for 2012 and 2011 were losses of $8.2 million and $26.1 million, respectively, related to the early retirement of debt in connection with debt refinancing.
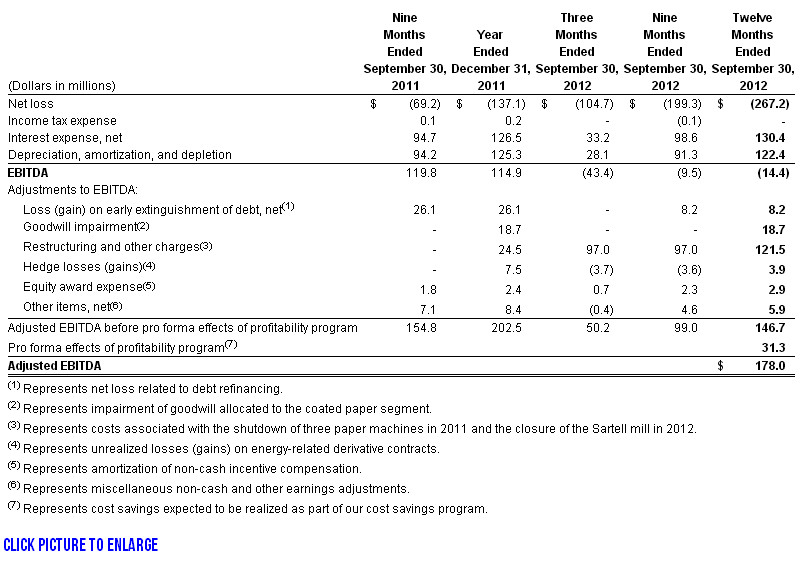
Reconciliation of Net Income to Adjusted EBITDA
The agreements governing our debt contain financial and other restrictive covenants that limit our ability to take certain actions, such as incurring additional debt or making acquisitions. Although we do not expect to violate any of the provisions in the agreements governing our outstanding indebtedness, these covenants can result in limiting our long-term growth prospects by hindering our ability to incur future indebtedness or grow through acquisitions.
EBITDA consists of earnings before interest, taxes, depreciation, and amortization. EBITDA is a measure commonly used in our industry, and we present EBITDA to enhance your understanding of our operating performance. We use EBITDA as a way of evaluating our performance relative to that of our peers. We believe that EBITDA is an operating performance measure, and not a liquidity measure, that provides investors and analysts with a measure of operating results unaffected by differences in capital structures, capital investment cycles, and ages of related assets among otherwise comparable companies. Adjusted EBITDA is EBITDA further adjusted to eliminate the impact of certain items that we do not consider to be indicative of the performance of our ongoing operations and other pro forma adjustments permitted in calculating covenant compliance in the indentures governing our debt securities to test the permissibility of certain types of transactions. Adjusted EBITDA is modified to align the mark-to-market impact of derivative contracts used to economically hedge a portion of future natural gas purchases with the period in which the contracts settle and is modified to reflect the amount of net cost savings projected to be realized as a result of specified activities taken during the preceding 12-month period. You are encouraged to evaluate each adjustment and to consider whether the adjustment is appropriate. In addition, in evaluating adjusted EBITDA, you should be aware that in the future, we may incur expenses similar to the adjustments included in the presentation of adjusted EBITDA. We believe that the supplemental adjustments applied in calculating Adjusted EBITDA are reasonable and appropriate to provide additional information to investors. We also believe that Adjusted EBITDA is a useful liquidity measurement tool for assessing our ability to meet our future debt service, capital expenditures, and working capital requirements.
However, EBITDA and Adjusted EBITDA are not measurements of financial performance under U.S. GAAP, and our EBITDA and Adjusted EBITDA may not be comparable to similarly titled measures of other companies. You should not consider our EBITDA or Adjusted EBITDA as an alternative to operating or net income, determined in accordance with U.S. GAAP, as an indicator of our operating performance, or as an alternative to cash flows from operating activities, determined in accordance with U.S. GAAP, as an indicator of our cash flows or as a measure of liquidity. The following table reconciles net loss to EBITDA and Adjusted EBITDA for the periods presented.
Forward-Looking Statements
In this press release, all statements that are not purely historical facts are forward-looking statements within the meaning of Section 27A of the Securities Act of 1933 and Section 21E of the Securities Exchange Act of 1934. Forward-looking statements may be identified by the words "believe," "expect," "anticipate," "project," "plan," "estimate," "intend," and similar expressions. Forward-looking statements are based on currently available business, economic, financial, and other information and reflect management's current beliefs, expectations, and views with respect to future developments and their potential effects on Verso. Actual results could vary materially depending on risks and uncertainties that may affect Verso and its business. For a discussion of such risks and uncertainties, please refer to Verso's filings with the Securities and Exchange Commission. Verso assumes no obligation to update any forward-looking statement made in this press release to reflect subsequent events or circumstances or actual outcomes.
Source: Verso Paper Corp.