
Ianadmin
Wausau Paper Coated Products Achieves ISO 9001:2008 Certification
Wausau Paper, a leading provider of release liner products, is pleased to announce the certification of its coated products Manufacturing and Distribution Quality Management (MDQM) System to ISO 9001:2008. The certification assures that the Company’s coated products MDQM System complies with the performance standards set forth by the International Standards Organization (ISO), a group that sets rigorous quality and management standards for business worldwide.
“Driven by our commitment to continual improvement and to consistently produce products which meet or exceed customer expectations, we chose to pursue ISO certification utilizing BSI as our certifying body,” said Sheila Widule, strategic marketing manager. “Meeting the ever-growing customer demand for the highest level of quality is vital to the future success of our coated products business.” Widule further commented, “This certification is the end result of the intense effort by multi-functional groups within our Company dedicated to improving workflow and advancing our processes to ensure consistent top-quality products for our customers. Our decision to become ISO 9001:2008 certified is just another demonstration of our commitment to achieve total customer satisfaction.”
To further explore release liner solutions from Wausau Paper, visit www.wausaupaper.com.
Ecolab Completes Bond Financing
Ecolab Inc. has announced that it has completed its public offering of $500 million of 1.000% senior notes due 2015. Ecolab expects to use the net proceeds from the offering to repay a portion of its outstanding commercial paper borrowings and for general corporate purposes.
This press release does not constitute an offer to sell, or a solicitation of an offer to buy, any of the notes or any other security.
With 2011 pro forma sales of $11 billion and more than 40,000 employees, Ecolab Inc. (NYSE: ECL) is the global leader in water, hygiene and energy technologies and services that provide and protect clean water, safe food, abundant energy and healthy environments. Ecolab delivers comprehensive programs and services to the food, energy, healthcare, industrial and hospitality markets in more than 160 countries. For more Ecolab news and information, visit www.ecolab.com.
Source: Ecolab Inc.
Forestry Initiative Recognized for Progress in Protecting Forests of Tomorrow
The Sustainable Forestry Initiative® (SFI®) Inc. has made substantial progress in safeguarding forests and the communities that rely on them today and for future generations, according to an External Review Panel. 
"The Future is Decided Now, SFI's Annual Progress report, demonstrates how procurement and policy decisions today affect North America's forests tomorrow. Our actions today – from individuals choosing wood or paper products, to buyers setting out procurement principles, government agencies developing policies and conservationists planning research activities – affect our future, the future health of our forests and the future prosperity of rural communities across North America," said SFI President and CEO Kathy Abusow today. "This progress report also demonstrates how decisions by the SFI Board of Directors and our many partners set the standard for responsible forest management."
The report shows an increase of nearly 30% of companies certified to SFI sourcing requirements from December 2010 to December 2011 according to the SFI External Review Panel, an independent body that ensures the report fairly states the status of SFI program implementation. The SFI annual report reflects the substantial impact the Sustainable Forestry Initiative has on setting and achieving a high standard for the practice and continuous improvement of sustainable forest management in North America.
The following SFI achievements were specifically cited by the External Review Panel:
- Research – SFI is the only forest certification standard in North America requiring participants support forest research. In 2011 program participants invested $83.2 million for research activities. The total since 1995 is more than $1.3 billion.
- Conservation grants – Since 2010, SFI Inc. has committed $1.27 million for 29 projects through its Conservation and Community Partnerships Program., including five projects in 2012 that focus on water resource management.
- Working with communities – Close to 900 people are involved with 37 grassroots SFI Implementation Committees. They have contributed $2.5 million to support local programs such as logger training and landowner outreach in 2011, for a total of $60.2 million since 1995.
- Training loggers – Nearly 6500 resource and logging professionals were trained in responsible forestry through the SFI or other recognized programs in 2011. SFI has helped 135,853 individuals complete training programs since 1995.
"Anyone who wants to learn how they can help SFI make a difference in forests and communities, and in markets around the globe is welcome to attend our 2012 Annual Conference," Abusow said.
Verso Paper Corp. Reports Second Quarter 2012 Results
Verso Paper Corp. has reported financial results for the second quarter and six months ended June 30, 2012. Results for the quarters ended June 30, 2012 and 2011 include:
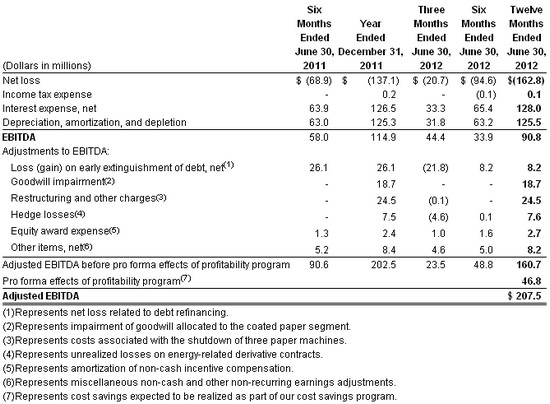
- EBITDA of $44.4 million in the second quarter of 2012 compared to $38.8 million in the second quarter of 2011, and Adjusted EBITDA before pro forma effects of profitability program of $23.5 million in the second quarter of 2012, compared to $43.6 million in the second quarter of 2011. (Note: EBITDA and Adjusted EBITDA are non-GAAP financial measures and are defined and reconciled to net income later in this release).
- Net loss of $20.7 million in the second quarter of 2012, or $0.39 per diluted share, compared to a net loss of $24.3 million, or $0.46 per diluted share in the second quarter of 2011.
- Operating loss of $9.5 million in the second quarter of 2012 compared to operating income of $7.0 million in the second quarter of 2011.
- Net sales of $365.3 million in the second quarter of 2012 compared to $398.8 million in the second quarter of 2011.
Overview
Verso's net sales for the second quarter of 2012 decreased $33.5 million, or 8.4%, reflecting a 5.5% decrease in the average sales price for all of our products combined with a 3.1% decline in total sales volume, which was driven by the shutdown of three paper machines late last year. Verso's gross margin was 11.5% for the second quarter of 2012 compared to 15.1% for the second quarter of 2011, reflecting the higher average sales prices during 2011.
Verso reported a net loss of $20.7 million in the second quarter of 2012, or $0.39 per diluted share, which included $22.4 million of net benefits from special items, or $0.42 per diluted share, primarily due to debt refinancing. Verso had a net loss of $24.3 million, or $0.46 per diluted share, in the second quarter of 2011, which included $3.7 million of charges from special items, or $0.07 per diluted share.
"Demand in the coated industry continued to be challenged during the second quarter of 2012 which resulted in a delay in the announced price increases during the quarter. This was primarily a result of the drop-off in advertising spending and slowdowns in the commercial print area which are impacted by the sluggish GDP growth. However, our coated groundwood and coated freesheet volumes were relatively flat with last year's levels and we did a good job of managing our pricing relative to overall market demand. Adjusted EBITDA was comparable to the first quarter of this year and slightly better if you exclude the over $5.0 million impact related to scheduled maintenance outages we took during the second quarter," said David Paterson, President and Chief Executive Officer of Verso.
"Our company was further challenged during the quarter by the fire and explosion at our Sartell Mill that resulted in the tragic loss of one of our employees and injuries to four others. As we announced last week, we have made the decision not to restart the Sartell Mill and will begin to evaluate options relative to the future of the site.
"We anticipate that coated groundwood prices will gain positive momentum throughout the third quarter and coated freesheet prices to be stable as we move into the busier second half of the year. Overall, volumes will be similar to last year's levels after giving consideration to the Sartell Mill closure. We expect operating costs to benefit from the continuation of our cost reduction initiatives and input prices are expected to remain fairly flat versus the second quarter. The U.S. coated groundwood market should be relatively in balance for the remainder of the year as a result of recent capacity reductions including the recently announced closure of our Sartell Mill."
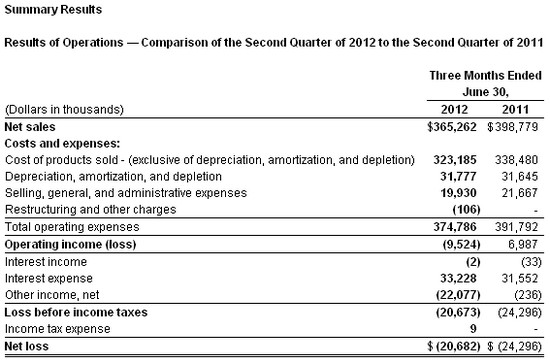
Net Sales. Net sales for the second quarter of 2012 decreased 8.4%, to $365.3 million from $398.8 million in the second quarter of 2011, reflecting a 5.5% decrease in the average sales price for all of our products, led by a quarter-over-quarter decline in the price of pulp, although it was up on a sequential-quarter basis. Additionally, total sales volume was down 3.1% compared to the second quarter of 2011, which was driven by the shutdown of three paper machines late last year.
Net sales for our coated papers segment decreased 11.1% in the second quarter of 2012 to $285.0 million from $320.7 million for the same period in 2011, due to a 7.8% decrease in paper sales volume, which was driven by the shutdown of three paper machines late last year, combined with a 3.7% decrease in the average paper sales price per ton.
Net sales for our market pulp segment were $36.2 million in both the second quarter of 2012 and 2011. The average sales price per ton decreased 11.9% while sales volume increased 13.7% compared to the second quarter of 2011.
Net sales for our other segment increased 5.0% to $44.1 million in the second quarter of 2012 from $41.9 million in the second quarter of 2011. The improvement in 2012 was due to a 12.7% increase in sales volume, reflecting the continued development of new paper product offerings for our customers. The average sales price per ton decreased 6.8%.
Cost of sales. Cost of sales, including depreciation, amortization, and depletion, was $355.0 million in the second quarter of 2012 compared to $370.1 million in 2011. Our gross margin, excluding depreciation, amortization, and depletion, was 11.5% for the second quarter of 2012 compared to 15.1% for the second quarter of 2011, reflecting higher average sales prices during 2011. Depreciation, amortization, and depletion expenses were $31.8 million for the second quarter of 2012 compared to $31.6 million for the second quarter of 2011.
Selling, general, and administrative. Selling, general, and administrative expenses were $19.9 million in the second quarter of 2012 compared to $21.7 million for the same period in 2011.
Interest expense. Interest expense for the second quarter of 2012 was $33.3 million compared to $31.6 million for the same period in 2011.
Other income, net. Other income, net for the second quarter of 2012 was a gain of $22.1 million compared to a gain of $0.2 million for the second quarter of 2011. Included in the results for the second quarter of 2012 were gains of $21.8 million related to the early retirement of debt in connection with debt refinancing.
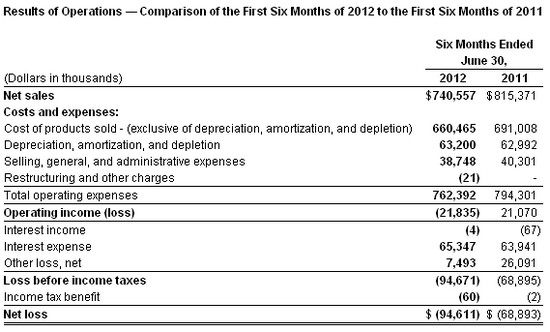
Net Sales. Net sales for the six months ended June 30, 2012, decreased 9.2% to $740.6 million from $815.4 million for the six months ended June 30, 2011, reflecting a 5.7% decrease in total sales volume, which was driven by the shutdown of three paper machines late last year. Additionally, the average sales price for all of our products decreased 3.7%, led by a decline in the price of pulp.
Net sales for our coated papers segment decreased 12.5% to $588.2 million for the six months ended June 30, 2012, from $672.4 million for the six months ended June 30, 2011. This change reflects an 11.0% decrease in paper sales volume, which was driven by the shutdown of three paper machines late last year, combined with a 1.8% decrease in the average coated paper sales price per ton compared to the same period last year.
Net sales for our market pulp segment decreased 3.9% to $69.1 million for the six months ended June 30, 2012, from $71.9 million for the same period in 2011. This decrease was due to a 13.3% decline in the average sales price per ton while sales volume increased 10.8% compared to the six months ended June 30, 2011.
Net sales for our other segment increased 17.1% to $83.3 million for the six months ended June 30, 2012, from $71.1 million for the six months ended June 30, 2011. The improvement in 2012 is due to a 21.5% increase in sales volume, reflecting the continued development of new paper product offerings for our customers. The average sales price per ton decreased 3.6% compared to the six months ended June 30, 2011.
Cost of sales. Cost of sales, including depreciation, amortization, and depletion, were $723.7 million for the six months ended June 30, 2012, compared to $754.0 million for the same period last year. Our gross margin, excluding depreciation, amortization, and depletion, was 10.8% for the six months ended June 30, 2012, compared to 15.3% for the six months ended June 30, 2011, reflecting higher average sales prices during 2011. Depreciation, amortization, and depletion expenses were $63.2 million for the six months ended June 30, 2012, compared to $63.0 million for the six months endedJune 30, 2011.
Selling, general, and administrative. Selling, general, and administrative expenses were $38.7 million for the six months ended June 30, 2012, compared to $40.3 million for the same period in 2011.
Interest expense. Interest expense for the six months ended June 30, 2012, was $65.4 million compared to $64.0 million for the same period in 2011.
Other loss, net. Other loss, net for the six months ended June 30, 2012, was a net loss of $7.5 million compared to a net loss of $26.1 million for the six months ended June 30, 2011. Included in the results for 2012 and 2011 were losses of $8.2 million and $26.1 million, respectively, related to the early retirement of debt in connection with debt refinancing.
Reconciliation of Net Income to Adjusted EBITDA
The agreements governing our debt contain financial and other restrictive covenants that limit our ability to take certain actions, such as incurring additional debt or making acquisitions. Although we do not expect to violate any of the provisions in the agreements governing our outstanding indebtedness, these covenants can result in limiting our long-term growth prospects by hindering our ability to incur future indebtedness or grow through acquisitions.
EBITDA consists of earnings before interest, taxes, depreciation, and amortization. EBITDA is a measure commonly used in our industry, and we present EBITDA to enhance your understanding of our operating performance. We use EBITDA as a way of evaluating our performance relative to that of our peers. We believe that EBITDA is an operating performance measure, and not a liquidity measure, that provides investors and analysts with a measure of operating results unaffected by differences in capital structures, capital investment cycles, and ages of related assets among otherwise comparable companies. Adjusted EBITDA is EBITDA further adjusted to exclude unusual items and other pro forma adjustments permitted in calculating covenant compliance in the indentures governing our debt securities to test the permissibility of certain types of transactions. Adjusted EBITDA is modified to align the mark-to-market impact of derivative contracts used to economically hedge a portion of future natural gas purchases with the period in which the contracts settle and is modified to reflect the amount of net cost savings projected to be realized as a result of specified activities taken during the preceding 12-month period. We believe that the supplemental adjustments applied in calculating Adjusted EBITDA are reasonable and appropriate to provide additional information to investors. We also believe that Adjusted EBITDA is a useful liquidity measurement tool for assessing our ability to meet our future debt service, capital expenditures, and working capital requirements.
However, EBITDA and Adjusted EBITDA are not measurements of financial performance under U.S. GAAP, and our EBITDA and Adjusted EBITDA may not be comparable to similarly titled measures of other companies. You should not consider our EBITDA or Adjusted EBITDA as an alternative to operating or net income, determined in accordance with U.S. GAAP, as an indicator of our operating performance, or as an alternative to cash flows from operating activities, determined in accordance with U.S. GAAP, as an indicator of our cash flows or as a measure of liquidity. The following table reconciles net loss to EBITDA and Adjusted EBITDA for the periods presented.
Source: Verso Paper Corp.
Catalyst Paper reaches agreement on financing facilities
Catalyst Paper has announced that it has entered into a commitment letter with a Canadian chartered bank for a $175 million syndicated asset based loan facility (ABL Facility) maturing on the earlier of 5 years from date of closing and 90 days prior to maturity of any significant debt.
The ABL Facility is a pre-condition for Catalyst to exit from creditor protection and would provide for the refinancing of existing credit facilities to fund the operations of the Company on exit from creditor protection and for general corporate purposes thereafter. The collateral would primarily consist of all present and future working capital assets of the Company. The ABL borrowing base would be calculated on balances of eligible accounts receivable and inventory, less certain reserves. Customary fees are payable in connection with the ABL Facility. The ABL Facility is subject to the completion of a credit agreement, syndication, documentation and certain other conditions.
Catalyst also entered into a commitment letter with respect to a secured exit notes facility of up to US$80 million (Exit Facility). The Exit Facility provides Catalyst with backstop financing should additional funding be required to pay costs and expenses or manage other contingencies on exit from creditor protection.
“Having appropriate financing in place should enable a return to normal trade terms with our vendors as we exit from creditor protection and will, in turn, assure our customers of continued excellent service and product quality going forward,” said Catalyst President and Chief Executive Officer Kevin J. Clarke. “We kept high operating standards throughout this process and this gives us competitive momentum as we prepare to emerge successfully from CCAA in the near term.”
The Exit Facility will be provided by certain holders of Catalyst’s First Lien Notes and will be secured by a charge on certain assets of Catalyst and its subsidiaries ranking senior to the lien securing the $250 million of new secured notes (the Plan Notes) to be issued under the Second Amended Plan of Arrangement (the Amended Plan). Customary commitment fees for a facility of this nature are payable to the lenders in connection with the Exit Facility.
The Exit Facility of US$80 million, or a lesser amount at Catalyst’s option, or if Catalyst’s liquidity exceeds a specified amount, is available to Catalyst upon its exit from creditor protection, has a maturity date of four years from that exit and can be prepaid in whole or in part at any time for a premium initially of 3% and declining annually thereafter. The Exit Facility is subject to the completion of documentation and certain other conditions.
To provide sufficient time to complete documentation for the ABL Facility and Exit Facility and to satisfy the other conditions under the Amended Plan, Catalyst and certain noteholders have agreed to amend the Restructuring and Support Agreement dated March 11, 2012, as amended (the RSA) to extend the deadline for completion of the Amended Plan to September 14, 2012. The RSA and Amended Plan previously provided for completion within 45 days of the Canadian sanction order, which was obtained on June 28, 2012.
Further Information and Monitor Contact Information
For more information please refer to Catalyst Paper’s management proxy circular dated March 23, 2012 (the Circular) available on SEDAR (www.sedar.com), EDGAR (www.sec.gov) and Catalyst Paper’s web page (www.catalystpaper.com). Terms used in this news release that are defined in the Circular have corresponding meanings.
A copy of the Amended Plan as well as additional information concerning the Amended Plan is contained on the Monitor’s website, which is available at http://www.pwc.com/ca/en/car/catalyst-paper-corporation/index.jhtml. Creditors who have questions about the Amended Plan may contact the Monitor at PricewaterhouseCoopers Inc., 250 Howe Street, Suite 700, Vancouver, British Columbia, V6C 3S7 (Attention: Patricia Marshall), phone: 604-806-7070 or email: This email address is being protected from spambots. You need JavaScript enabled to view it..
Ahlstrom's new filtration materials investment in Turin plant completed
Ahlstrom, a global high performance materials company, has completed an investment on additional capacity in filtration material at its site in Turin, Italy. The company has started to ramp up its new saturator line, which is expected to be commercial during the third quarter of 2012, slightly ahead of the planned schedule. The value of the investment, initially announced in December 2010, is approximately EUR 17.5 million.
"This capacity increase in Turin is an important step for Ahlstrom's Filtration business area. We are committed to grow with our customers as a global supplier in the filtration market with a full offering of filter media. We are pleased to be able to provide the newest technology to our customers, both for transportation and advanced filtration materials. This way we will help our customers to stay ahead," stated Tommi Björnman, Executive Vice President, Filtration.
"We are excited about the new saturator line, which has state-of-the-art control equipment that ensures manufacturing of a very consistent, clean and high quality media," said Gary Blevins, Vice President, Transportation Filtration.
Ahlstrom is the global leader of filtration materials with 11 production sites across four continents. Earlier this year, Ahlstrom announced that it has completed significant upgrades with various filtration testing and simulation equipment to its Global Filtration Technical Center in Turin, Italy. These investments ensure Ahlstrom's capabilities to offer new and innovative solutions for its customers globally.
Xerium Technologies Reports Second Quarter Results
Profitability Improves over First Quarter
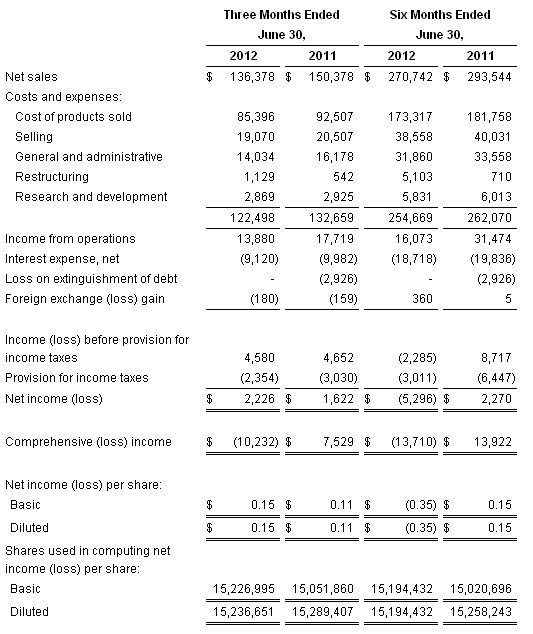
Xerium Technologies, Inc. (NYSE: XRM), a leading global manufacturer of industrial textiles and roll covers used primarily in the paper production process, announced today the results of its operations for the quarter ended June 30, 2012. Net sales increased 1.5% from the quarter ended March 31, 2012, yet decreased 9.3% from the quarter ended June 30, 2011. On a year to date basis, net sales decreased 7.8% from the six months ended June 30, 2011. Net income per diluted share improved to $0.15 for the quarter ended June 30, 2012 from ($0.50) for the quarter ended March 31, 2012 and$0.11 for the quarter ended June 30, 2011. On a year to date basis, net income per diluted share decreased to a loss of ($0.35) for the six months ended June 30, 2012 from income of $0.15 for the six months ended June 30, 2011.
“Xerium’s second quarter 2012 over first quarter 2012 performance improvement is the result of our continuous focus on operational improvements, our customers’ accelerating adoption of our better performing and higher margin new products, and reduced trade working capital in every region,” said Stephen R. Light, Chief Executive Officer and Chairman. “ While our European business remains soft as the paper industry there is impacted by the region’s ongoing economic crisis, we enjoyed good growth in North America and Asia. 'Vision 2015,' Xerium’s three year strategic realignment of our manufacturing footprint, announced on July 2, 2012, is off to a good start. We expect 'Vision 2015' will restore our historical margins by reducing unnecessary fixed costs and aligning our global capacity with customer demand.”
RESTRUCTURING
As previously reported, on July 2, 2012, we announced a voluntary redundancy program at our press felt facility in Buenos Aires, Argentina in connection with the relocation of our Huyck Wangner press felt capacity and initiated consultation proceedings with our works' council at our rolls cover facility in Meyzieu, Franceregarding a proposal to cease operations there. In Argentina, the production of press felts and fiber cement felts will be transferred to our facilities in Brazil and the roll cover production of our facility in France will be assumed by our rolls facilities in Germany and Italy. The actions are expected to commence in the third quarter of 2012 and be completed over the next several months. As the redundancy program has just been initiated, the proceedings with the works’ council have just begun and there has been no formal evaluation of the affected assets, at this time, we are in the process of analyzing our estimate of the restructuring charges and asset impairments, if any, related to these redundancy programs.
CREDIT FACILITY AMENDMENT
To facilitate the above restructuring activities, on June 28, 2012, we entered into an amendment to our senior secured credit facility. Among other revisions to the credit facility, the amendment allows for additional add backs to Adjusted EBITDA annually through 2015 up to the lesser of $15.0 million or the unused portion of our allowed annual capital expenditure limit; increases the maximum leverage ratios between September of 2012 and December of 2013; amends the definition of the leverage ratio to reduce debt by unrestricted surplus cash held by the Company and increases the interest rate on the term loans by 0.75% annually for eighteen months.
SECOND QUARTER FINANCIAL HIGHLIGHTS
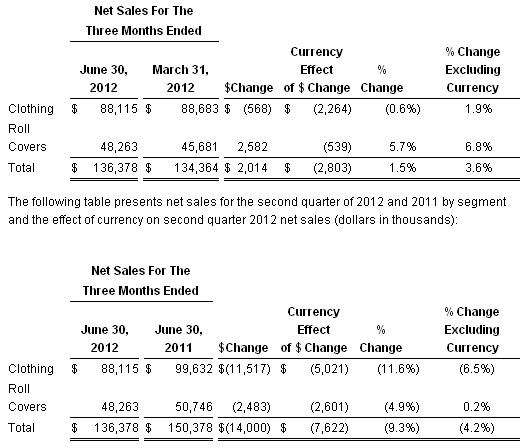
- Net sales for the second quarter of 2012 were $136.4 million, a 1.5% increase compared to the first quarter of 2012. Excluding unfavorable currency effects of$2.8 million, second quarter 2012 net sales increased 3.6% from the first quarter of 2012, with an increase of 1.9% in the clothing segment and an increase of 6.8% in the roll covers segment. Net sales decreased 9.3% from net sales for the second quarter of 2011 of $150.4 million. Excluding unfavorable currency effects of 5.1%, second quarter 2012 net sales decreased 4.2% from the second quarter of 2011, with a decrease of 6.5% in the clothing segment, primarily as a result of the reduced European market demand, and an increase of 0.2% in the roll covers segment. See “Segment Information” and “Non-GAAP Financial Measures” below for further discussion.
- Gross profit increased by 9.8% to $51.0 million for the second quarter of 2012 from $46.4 million for the first quarter of 2012, yet decreased 11.9% from $57.9 million for the second quarter of 2011. In the second quarter of 2012, gross margins increased to 37.4% from 34.6% in the first quarter of 2012. The increase was due to improved product mix, partially as a result of an unusually high level of low margin steel core sales in the first quarter of 2012 and improved labor efficiencies. These increases were offset by currency exchange rate differences and unfavorable factory absorption driven by continued progress in reducing inventory levels. Gross margins declined from 38.5% in the second quarter of 2011 largely as a result of the reduction of inventory reserves in the prior year. Excluding this non-recurring item, gross margins were relatively flat compared to the second quarter of 2011, as unfavorable absorption of production costs and unfavorable regional mix related to the reduced European market demand were partially offset by favorable currency effects and improved material and labor cost efficiencies.
- The Company’s operating expenses (selling, general and administrative, restructuring and research and development expenses) of $37.1 million for the second quarter of 2012 decreased by $3.1 million, or 7.7%, from operating expenses of $40.2 million in the second quarter of 2011. The decrease in operating expenses during the second quarter of 2012 is primarily the result of favorable currency effects of $2.5 million, a decrease of $1.6 million in management incentive compensation and the reversal of a $1.0 million contingent liability that was favorably resolved. Partially offsetting these items was an increase in general and administrative expenses due to the reversal in 2011 of $1.1 million in value added tax in Brazil and $0.6 million related to incremental CEO transition costs in 2012.
- Interest expense improved 9.0% to $9.1 million in the second quarter of 2012 from $10.0 million in the second quarter of 2011. This decline in interest expense reflects lower current interest rates and debt balances and favorable currency effects, net of higher deferred financing cost amortization in the second quarter of 2012. The decrease in interest rates and the increase in deferred financing cost amortization are a result of the refinancing in May 2011. Cash interest expense, or interest expense less amortization of deferred financing costs, decreased by 12.5% in the second quarter of 2012 to $8.4 millioncompared to $9.6 million in the second quarter of 2011.
- Income tax expense declined to $2.4 million in the second quarter of 2012 from $3.0 million in the second quarter of 2011. This reduction was primarily attributable to the geographic mix of earnings in the second quarter of 2012 as compared to the second quarter of 2011. Our overall effective tax rate for the periods presented reflects the fact that we have losses in certain jurisdictions where we receive no tax benefit.
- Net income for the second quarter of 2012 improved to $2.2 million or $0.15 per diluted share, compared to net loss of ($7.5) million or ($0.50) per diluted share for the first quarter of 2012 and net income of $1.6 million or $0.11 per diluted share for the second quarter of 2011.
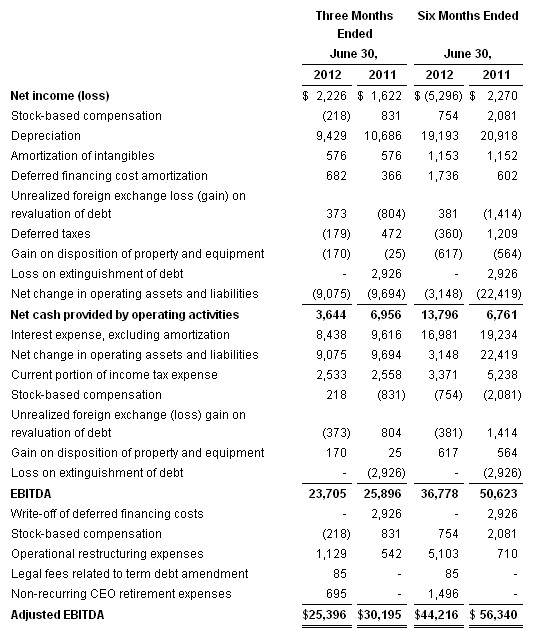
- Adjusted EBITDA (as defined by the Company’s credit facility) of $25.4 million increased $6.6 million in the current quarter from $18.8 million in the first quarter of 2012, yet decreased $4.8 million from $30.2 million in the second quarter of 2011. See “Non-GAAP Financial Measures” below for further discussion.
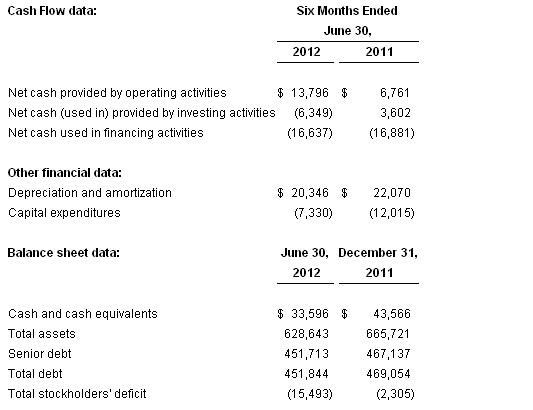
- Cash at June 30, 2012 was $33.6 million, compared to $43.6 million at December 31, 2011. The decrease in the cash balances from December 31, 2011 is primarily due to $14.9 million in payments on long-term debt, capital expenditures of $7.3 million, $1.8 million in payments relating to the credit facility amendment and unfavorable currency effects of $0.8 million. These decreases were partially offset by cash provided by operating activities of $13.8 millionand proceeds from the disposition of property of $1.0 million.
- Total debt at June 30, 2012 was $451.8 million, compared to $469.1 million at December 31, 2011. The decrease of $17.3 million from December 31. 2011 is primarily due to net debt payments of $14.9 million in 2012 and favorable currency effects of $2.4 million.
- Capital expenditures for the six months ended June 30, 2012 were $7.3 million, consisting of $2.1 million in growth capex and $5.2 million in maintenance capex. In the same period in 2011, we reported $12.0 million of capital spending, consisting of $4.6 million in growth capex and $7.4 million of maintenance capex. We are currently targeting total capital expenditure commitments for 2012 at approximately $30 million, while actual cash spent on capital expenditures may be somewhat less due to the timing of the equipment installations.
SEGMENT INFORMATION
The following table presents net sales for the first and second quarter of 2012 by segment and the effect of currency on second quarter 2012 net sales (dollars in thousands):
CONFERENCE CALL
The Company plans to hold a conference call on the following morning:
| Date: | Tuesday, August 7, 2012 | ||||
| Start Time: | 9:00 a.m. Eastern Time | ||||
| Domestic Dial-In: | +1-866-831-6247 | ||||
| International Dial-In: | +1-617-213-8856 | ||||
| Passcode: | 73944707 | ||||
| Webcast & Slide Presentation: |
To participate on the call, please dial in at least 10 minutes prior to the scheduled start. A live audio webcast and replay of the call, in addition to a slide presentation, may be found in the investor relations section of the company’s website at www.xerium.com.
NON-GAAP FINANCIAL MEASURES
This press release includes measures of performance that differ from the Company’s financial results as reported under generally accepted accounting principles (“GAAP”). The Company uses supplementary non-GAAP measures, including EBITDA, Adjusted EBITDA and currency effects on Net Sales to assist in evaluating its liquidity and financial performance. EBITDA and Adjusted EBITDA are specifically used in evaluating the ability to service indebtedness and to fund ongoing capital expenditures. The Company’s credit facility includes covenants based upon Adjusted EBITDA. If Adjusted EBITDA declines below certain levels, the Company could go into default under its credit facility or be required to prepay the credit facility. Neither Adjusted EBITDA nor EBITDA should be considered in isolation or as a substitute for income (loss) or cash flows from operations (as determined in accordance with GAAP).
For additional information regarding non-GAAP financial measures and a reconciliation of such measures to the most comparable financial measures under GAAP, please see “Segment Information” above and our Selected Financial Data below. In addition, the information in this press release should be read in conjunction with the corresponding exhibits, financial statements and footnotes contained in our documents to be filed with the Securities and Exchange Commission.
FORWARD-LOOKING STATEMENTS
This press release contains forward-looking statements involving risks and uncertainties, both known and unknown, that may cause actual results to differ materially from those indicated. These risks and uncertainties include the following items: (1) a sustained downturn in the paper industry, compounded by uncertainty in global economic conditions, particularly those stemming from Europe, could adversely affect our revenues and profitability; (2) our financial results could be adversely affected by fluctuations in interest rates and currency exchange rates, for instance a marked decline in the value of the Euro relative to the U.S. Dollar stemming from the European sovereign debt crisis; (3) market improvement in our industry may occur more slowly than we anticipate, may stall or may not occur at all; (4) variations in demand for our products, including our new products, could negatively affect our revenues and profitability; (5) our manufacturing facilities may be required to quickly increase or decrease production, which could negatively affect our production facilities, customer order lead time, product quality, labor relations or gross profits; (6) our plans to develop and market new products, enhance operational efficiencies, and reduce costs may not be successful; and (7) the other risks and uncertainties discussed elsewhere in this press release, our Form 10-K for the year ended December 31, 2011 filed on March 14, 2012 and our other SEC filings. If any of these risks or uncertainties materialize, or if our underlying assumptions prove to be incorrect, actual results may vary significantly from what we projected. Any forward-looking statement in this press release reflects our current views with respect to future events. We assume no obligation to publicly update or revise these forward-looking statements for any reason, whether as a result of new information, future events, or otherwise. As discussed above, we are subject to substantial risks and uncertainties related to current economic conditions, and we encourage investors to refer to our SEC filings for additional information. Copies of these filings are available from the SEC and in the investor relations section of our website at www.xerium.com.
Selected Financial Data Follows
|
Xerium Technologies, Inc. |
||||||||||||||||
|
Condensed Consolidated Statements of Operations and Comprehensive (Loss) Income |
||||||||||||||||
|
(dollars in thousands, except per share data) |
| Condensed Consolidated Selected Financial Data | |||||||
| (in thousands) |
EBITDA and Adjusted EBITDA Non-GAAP Measures
Non-GAAP Financial Measures
We use EBITDA and Adjusted EBITDA (as defined in our credit facility) as supplementary non-GAAP liquidity measures to assist us in evaluating our liquidity and financial performance, specifically our ability to service indebtedness and to fund ongoing capital expenditures. The credit facility includes covenants based on Adjusted EBITDA. If our Adjusted EBITDA declines below certain levels, we may violate the covenants resulting in a default condition under the credit facility or be required to prepay the credit facility. Neither EBITDA nor Adjusted EBITDA should be considered in isolation or as a substitute for income (loss) or cash flows from operations (as determined in accordance with GAAP).
EBITDA is defined as net income (loss) before interest expense, income tax provision (benefit) and depreciation (including non-cash impairment charges) and amortization.
“Adjusted EBITDA”, under our credit facility means, with respect to any period, the total of (A) the consolidated net income for such period, plus (B) without duplication, to the extent that any of the following were deducted in computing such consolidated net income for such period: (i) provision for taxes based on income or profits, including, without limitation, federal, state, provincial, franchise and similar taxes, including any penalties and interest relating to any tax examinations, (ii) consolidated interest expense, (iii) consolidated depreciation and amortization expense, (iv) reserves for inventory in connection with plant closures, (v) consolidated operational restructuring costs, (vi) noncash charges or gains resulting from the application of purchase accounting, including push-down accounting, (vii) non-cash expenses resulting from the granting of common stock, stock options, restricted stock or restricted stock unit awards under equity compensation programs solely with respect to common stock, and cash expenses for compensation mandatorily applied to purchase common stock, (viii) non-cash items relating to a change in or adoption of accounting policies, (ix) non-cash expenses relating to pension or benefit arrangements, (x) expenses incurred as a result of the repurchase, redemption or retention of common stock earned under equity compensation programs solely in order to make withholding tax payments, (xi) amortization or write-offs of deferred financing costs, (xii) any non-cash losses resulting from mark to market hedging obligations (to the extent the cash impact resulting from such loss has not been realized in such period) and (xiii) other non-cash losses or charges (excluding, however, any non-cash loss or charge which represents an accrual of, or a reserve for, a cash disbursement in a future period), minus (C) without duplication, to the extent any of the following were included in computing consolidated net income for such period, (i) non-cash gains with respect to the items described in clauses (vi), (vii), (ix), (xi), (xii) and (xiii) (other than, in the case of clause (xiii), any such gain to the extent that it represents a reversal of an accrual of, or reserve for, a cash disbursement in a future period) of clause (B) above and (ii) provisions for tax benefits based on income or profits. Notwithstanding the foregoing, Adjusted EBITDA, as defined in the credit facility and calculated below, may not be comparable to similarly titled measurements used by other companies.
Consolidated net income is defined as net income (loss) determined on a consolidated basis in accordance with GAAP; provided, however, that the following, without duplication, shall be excluded in determining consolidated net income: (i) any net after-tax extraordinary or non-recurring gains, losses or expenses (less all fees and expenses relating thereto), (ii) the cumulative effect of changes in accounting principles, (iii) any fees and expenses incurred during such period in connection with the issuance or repayment of indebtedness, any refinancing transaction or amendment or modification of any debt instrument, in each case, as permitted under the credit facility and (iv) any gains resulting from the returned surplus assets of any pension plan.
The following table provides reconciliation from net income (loss) and operating cash flows, which are the most directly comparable GAAP financial measures, to EBITDA and Adjusted EBITDA. Please also see our exhibits to be filed with our current report on Form 8K, which should be read in conjunction with this release.
Source: Xerium Technologies, Inc.
ANDRITZ GROUP: satisfactory business development in Q2/H1 2012
Kemira to start co-determination negotiations in Finland
Kemira announced on July 26, 2012 that it will start a global restructuring program "Fit for Growth" to improve the company's profitability, internal efficiency and to accelerate growth in the emerging markets. Kemira also announced that the implementation of the measures related to the program may ultimately lead to the reduction of up to 600 positions globally, from which approximately 250 could be reductions in Finland.
Kemira will start co-determination negotiations in Finland which will affect all employees working at the following group's Finnish sites: Helsinki, Espoo, Oulu, Sastamala, Kuusankoski, Joutseno, Vaasa and Harjavalta. The invitation to the negotiations was given to the employee representatives today, on August 6, 2012. At the end of June 2012, Kemira had 5,181 employees from which 1,259 were located in Finland.
"The number of employees affected by the possible personnel reduction has now been specified and the measures related to the program may affect approximately 260 employees' work in Finland. During the negotiations we will examine e.g. internal transfers, retirement arrangements and outsourcing. Although we are not planning to close our sites in Finland, the possibility of some direct layoffs cannot unfortunately be ruled out. The number of possible direct layoffs will be defined during the negotiations. Our aim is to complete the negotiations within the 6 weeks negotiation period," says Jukka Oinonen, Vice President, Human Resources, Finland.
The cost savings target with the planned "Fit for Growth" program is EUR 60 million on an annualized basis once the program is fully implemented. Non-recurring charges related to the "Fit for Growth" program are estimated to be around EUR 85 million. These charges are expected to be accounted for within the next four quarters.
Organizational restructuring also affects Kemira's sites outside Finland and the negotiations in the sites affected by the possible personnel reductions will proceed in each country according to the local legislation. Kemira has operations in around 40 countries.