Verso Paper Corp. has reported financial results for the second quarter and six months ended June 30, 2012. Results for the quarters ended June 30, 2012 and 2011 include:
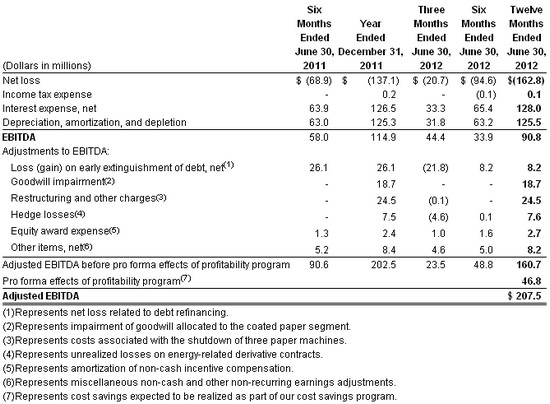
- EBITDA of $44.4 million in the second quarter of 2012 compared to $38.8 million in the second quarter of 2011, and Adjusted EBITDA before pro forma effects of profitability program of $23.5 million in the second quarter of 2012, compared to $43.6 million in the second quarter of 2011. (Note: EBITDA and Adjusted EBITDA are non-GAAP financial measures and are defined and reconciled to net income later in this release).
- Net loss of $20.7 million in the second quarter of 2012, or $0.39 per diluted share, compared to a net loss of $24.3 million, or $0.46 per diluted share in the second quarter of 2011.
- Operating loss of $9.5 million in the second quarter of 2012 compared to operating income of $7.0 million in the second quarter of 2011.
- Net sales of $365.3 million in the second quarter of 2012 compared to $398.8 million in the second quarter of 2011.
Overview
Verso's net sales for the second quarter of 2012 decreased $33.5 million, or 8.4%, reflecting a 5.5% decrease in the average sales price for all of our products combined with a 3.1% decline in total sales volume, which was driven by the shutdown of three paper machines late last year. Verso's gross margin was 11.5% for the second quarter of 2012 compared to 15.1% for the second quarter of 2011, reflecting the higher average sales prices during 2011.
Verso reported a net loss of $20.7 million in the second quarter of 2012, or $0.39 per diluted share, which included $22.4 million of net benefits from special items, or $0.42 per diluted share, primarily due to debt refinancing. Verso had a net loss of $24.3 million, or $0.46 per diluted share, in the second quarter of 2011, which included $3.7 million of charges from special items, or $0.07 per diluted share.
"Demand in the coated industry continued to be challenged during the second quarter of 2012 which resulted in a delay in the announced price increases during the quarter. This was primarily a result of the drop-off in advertising spending and slowdowns in the commercial print area which are impacted by the sluggish GDP growth. However, our coated groundwood and coated freesheet volumes were relatively flat with last year's levels and we did a good job of managing our pricing relative to overall market demand. Adjusted EBITDA was comparable to the first quarter of this year and slightly better if you exclude the over $5.0 million impact related to scheduled maintenance outages we took during the second quarter," said David Paterson, President and Chief Executive Officer of Verso.
"Our company was further challenged during the quarter by the fire and explosion at our Sartell Mill that resulted in the tragic loss of one of our employees and injuries to four others. As we announced last week, we have made the decision not to restart the Sartell Mill and will begin to evaluate options relative to the future of the site.
"We anticipate that coated groundwood prices will gain positive momentum throughout the third quarter and coated freesheet prices to be stable as we move into the busier second half of the year. Overall, volumes will be similar to last year's levels after giving consideration to the Sartell Mill closure. We expect operating costs to benefit from the continuation of our cost reduction initiatives and input prices are expected to remain fairly flat versus the second quarter. The U.S. coated groundwood market should be relatively in balance for the remainder of the year as a result of recent capacity reductions including the recently announced closure of our Sartell Mill."
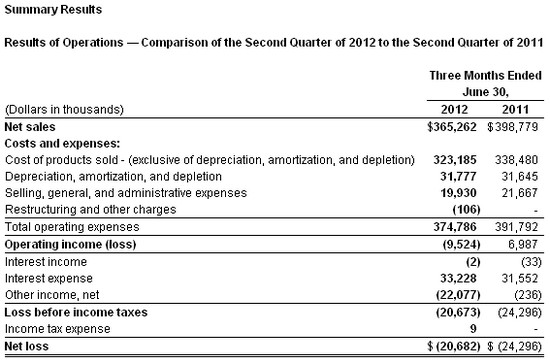
Net Sales. Net sales for the second quarter of 2012 decreased 8.4%, to $365.3 million from $398.8 million in the second quarter of 2011, reflecting a 5.5% decrease in the average sales price for all of our products, led by a quarter-over-quarter decline in the price of pulp, although it was up on a sequential-quarter basis. Additionally, total sales volume was down 3.1% compared to the second quarter of 2011, which was driven by the shutdown of three paper machines late last year.
Net sales for our coated papers segment decreased 11.1% in the second quarter of 2012 to $285.0 million from $320.7 million for the same period in 2011, due to a 7.8% decrease in paper sales volume, which was driven by the shutdown of three paper machines late last year, combined with a 3.7% decrease in the average paper sales price per ton.
Net sales for our market pulp segment were $36.2 million in both the second quarter of 2012 and 2011. The average sales price per ton decreased 11.9% while sales volume increased 13.7% compared to the second quarter of 2011.
Net sales for our other segment increased 5.0% to $44.1 million in the second quarter of 2012 from $41.9 million in the second quarter of 2011. The improvement in 2012 was due to a 12.7% increase in sales volume, reflecting the continued development of new paper product offerings for our customers. The average sales price per ton decreased 6.8%.
Cost of sales. Cost of sales, including depreciation, amortization, and depletion, was $355.0 million in the second quarter of 2012 compared to $370.1 million in 2011. Our gross margin, excluding depreciation, amortization, and depletion, was 11.5% for the second quarter of 2012 compared to 15.1% for the second quarter of 2011, reflecting higher average sales prices during 2011. Depreciation, amortization, and depletion expenses were $31.8 million for the second quarter of 2012 compared to $31.6 million for the second quarter of 2011.
Selling, general, and administrative. Selling, general, and administrative expenses were $19.9 million in the second quarter of 2012 compared to $21.7 million for the same period in 2011.
Interest expense. Interest expense for the second quarter of 2012 was $33.3 million compared to $31.6 million for the same period in 2011.
Other income, net. Other income, net for the second quarter of 2012 was a gain of $22.1 million compared to a gain of $0.2 million for the second quarter of 2011. Included in the results for the second quarter of 2012 were gains of $21.8 million related to the early retirement of debt in connection with debt refinancing.
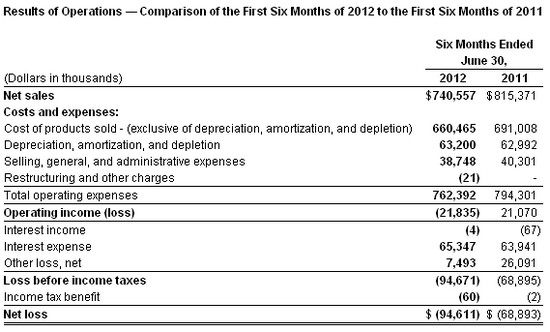
Net Sales. Net sales for the six months ended June 30, 2012, decreased 9.2% to $740.6 million from $815.4 million for the six months ended June 30, 2011, reflecting a 5.7% decrease in total sales volume, which was driven by the shutdown of three paper machines late last year. Additionally, the average sales price for all of our products decreased 3.7%, led by a decline in the price of pulp.
Net sales for our coated papers segment decreased 12.5% to $588.2 million for the six months ended June 30, 2012, from $672.4 million for the six months ended June 30, 2011. This change reflects an 11.0% decrease in paper sales volume, which was driven by the shutdown of three paper machines late last year, combined with a 1.8% decrease in the average coated paper sales price per ton compared to the same period last year.
Net sales for our market pulp segment decreased 3.9% to $69.1 million for the six months ended June 30, 2012, from $71.9 million for the same period in 2011. This decrease was due to a 13.3% decline in the average sales price per ton while sales volume increased 10.8% compared to the six months ended June 30, 2011.
Net sales for our other segment increased 17.1% to $83.3 million for the six months ended June 30, 2012, from $71.1 million for the six months ended June 30, 2011. The improvement in 2012 is due to a 21.5% increase in sales volume, reflecting the continued development of new paper product offerings for our customers. The average sales price per ton decreased 3.6% compared to the six months ended June 30, 2011.
Cost of sales. Cost of sales, including depreciation, amortization, and depletion, were $723.7 million for the six months ended June 30, 2012, compared to $754.0 million for the same period last year. Our gross margin, excluding depreciation, amortization, and depletion, was 10.8% for the six months ended June 30, 2012, compared to 15.3% for the six months ended June 30, 2011, reflecting higher average sales prices during 2011. Depreciation, amortization, and depletion expenses were $63.2 million for the six months ended June 30, 2012, compared to $63.0 million for the six months endedJune 30, 2011.
Selling, general, and administrative. Selling, general, and administrative expenses were $38.7 million for the six months ended June 30, 2012, compared to $40.3 million for the same period in 2011.
Interest expense. Interest expense for the six months ended June 30, 2012, was $65.4 million compared to $64.0 million for the same period in 2011.
Other loss, net. Other loss, net for the six months ended June 30, 2012, was a net loss of $7.5 million compared to a net loss of $26.1 million for the six months ended June 30, 2011. Included in the results for 2012 and 2011 were losses of $8.2 million and $26.1 million, respectively, related to the early retirement of debt in connection with debt refinancing.
Reconciliation of Net Income to Adjusted EBITDA
The agreements governing our debt contain financial and other restrictive covenants that limit our ability to take certain actions, such as incurring additional debt or making acquisitions. Although we do not expect to violate any of the provisions in the agreements governing our outstanding indebtedness, these covenants can result in limiting our long-term growth prospects by hindering our ability to incur future indebtedness or grow through acquisitions.
EBITDA consists of earnings before interest, taxes, depreciation, and amortization. EBITDA is a measure commonly used in our industry, and we present EBITDA to enhance your understanding of our operating performance. We use EBITDA as a way of evaluating our performance relative to that of our peers. We believe that EBITDA is an operating performance measure, and not a liquidity measure, that provides investors and analysts with a measure of operating results unaffected by differences in capital structures, capital investment cycles, and ages of related assets among otherwise comparable companies. Adjusted EBITDA is EBITDA further adjusted to exclude unusual items and other pro forma adjustments permitted in calculating covenant compliance in the indentures governing our debt securities to test the permissibility of certain types of transactions. Adjusted EBITDA is modified to align the mark-to-market impact of derivative contracts used to economically hedge a portion of future natural gas purchases with the period in which the contracts settle and is modified to reflect the amount of net cost savings projected to be realized as a result of specified activities taken during the preceding 12-month period. We believe that the supplemental adjustments applied in calculating Adjusted EBITDA are reasonable and appropriate to provide additional information to investors. We also believe that Adjusted EBITDA is a useful liquidity measurement tool for assessing our ability to meet our future debt service, capital expenditures, and working capital requirements.
However, EBITDA and Adjusted EBITDA are not measurements of financial performance under U.S. GAAP, and our EBITDA and Adjusted EBITDA may not be comparable to similarly titled measures of other companies. You should not consider our EBITDA or Adjusted EBITDA as an alternative to operating or net income, determined in accordance with U.S. GAAP, as an indicator of our operating performance, or as an alternative to cash flows from operating activities, determined in accordance with U.S. GAAP, as an indicator of our cash flows or as a measure of liquidity. The following table reconciles net loss to EBITDA and Adjusted EBITDA for the periods presented.
Source: Verso Paper Corp.